12 - ELF Coredump
This tutorial introduces the API to analyze and manipulate ELF coredump
Files and scripts used in this tutorial are available on the tutorials repository
Introduction
ELF core [1] files provide information about the CPU state and the memory state of a program when the coredump has been generated. The memory state embeds a snapshot of all segments mapped in the memory space of the program. The CPU state contains register values when the core dump has been generated.
Coredump files use a subset of the ELF structures to store this information. Segments are used for the memory state of the process while ELF notes (lief.ELF.Note) are used for process metadata (pid, signal, …) Especially, the CPU state is stored in a note with a special type.
Here is an overview of coredump layout :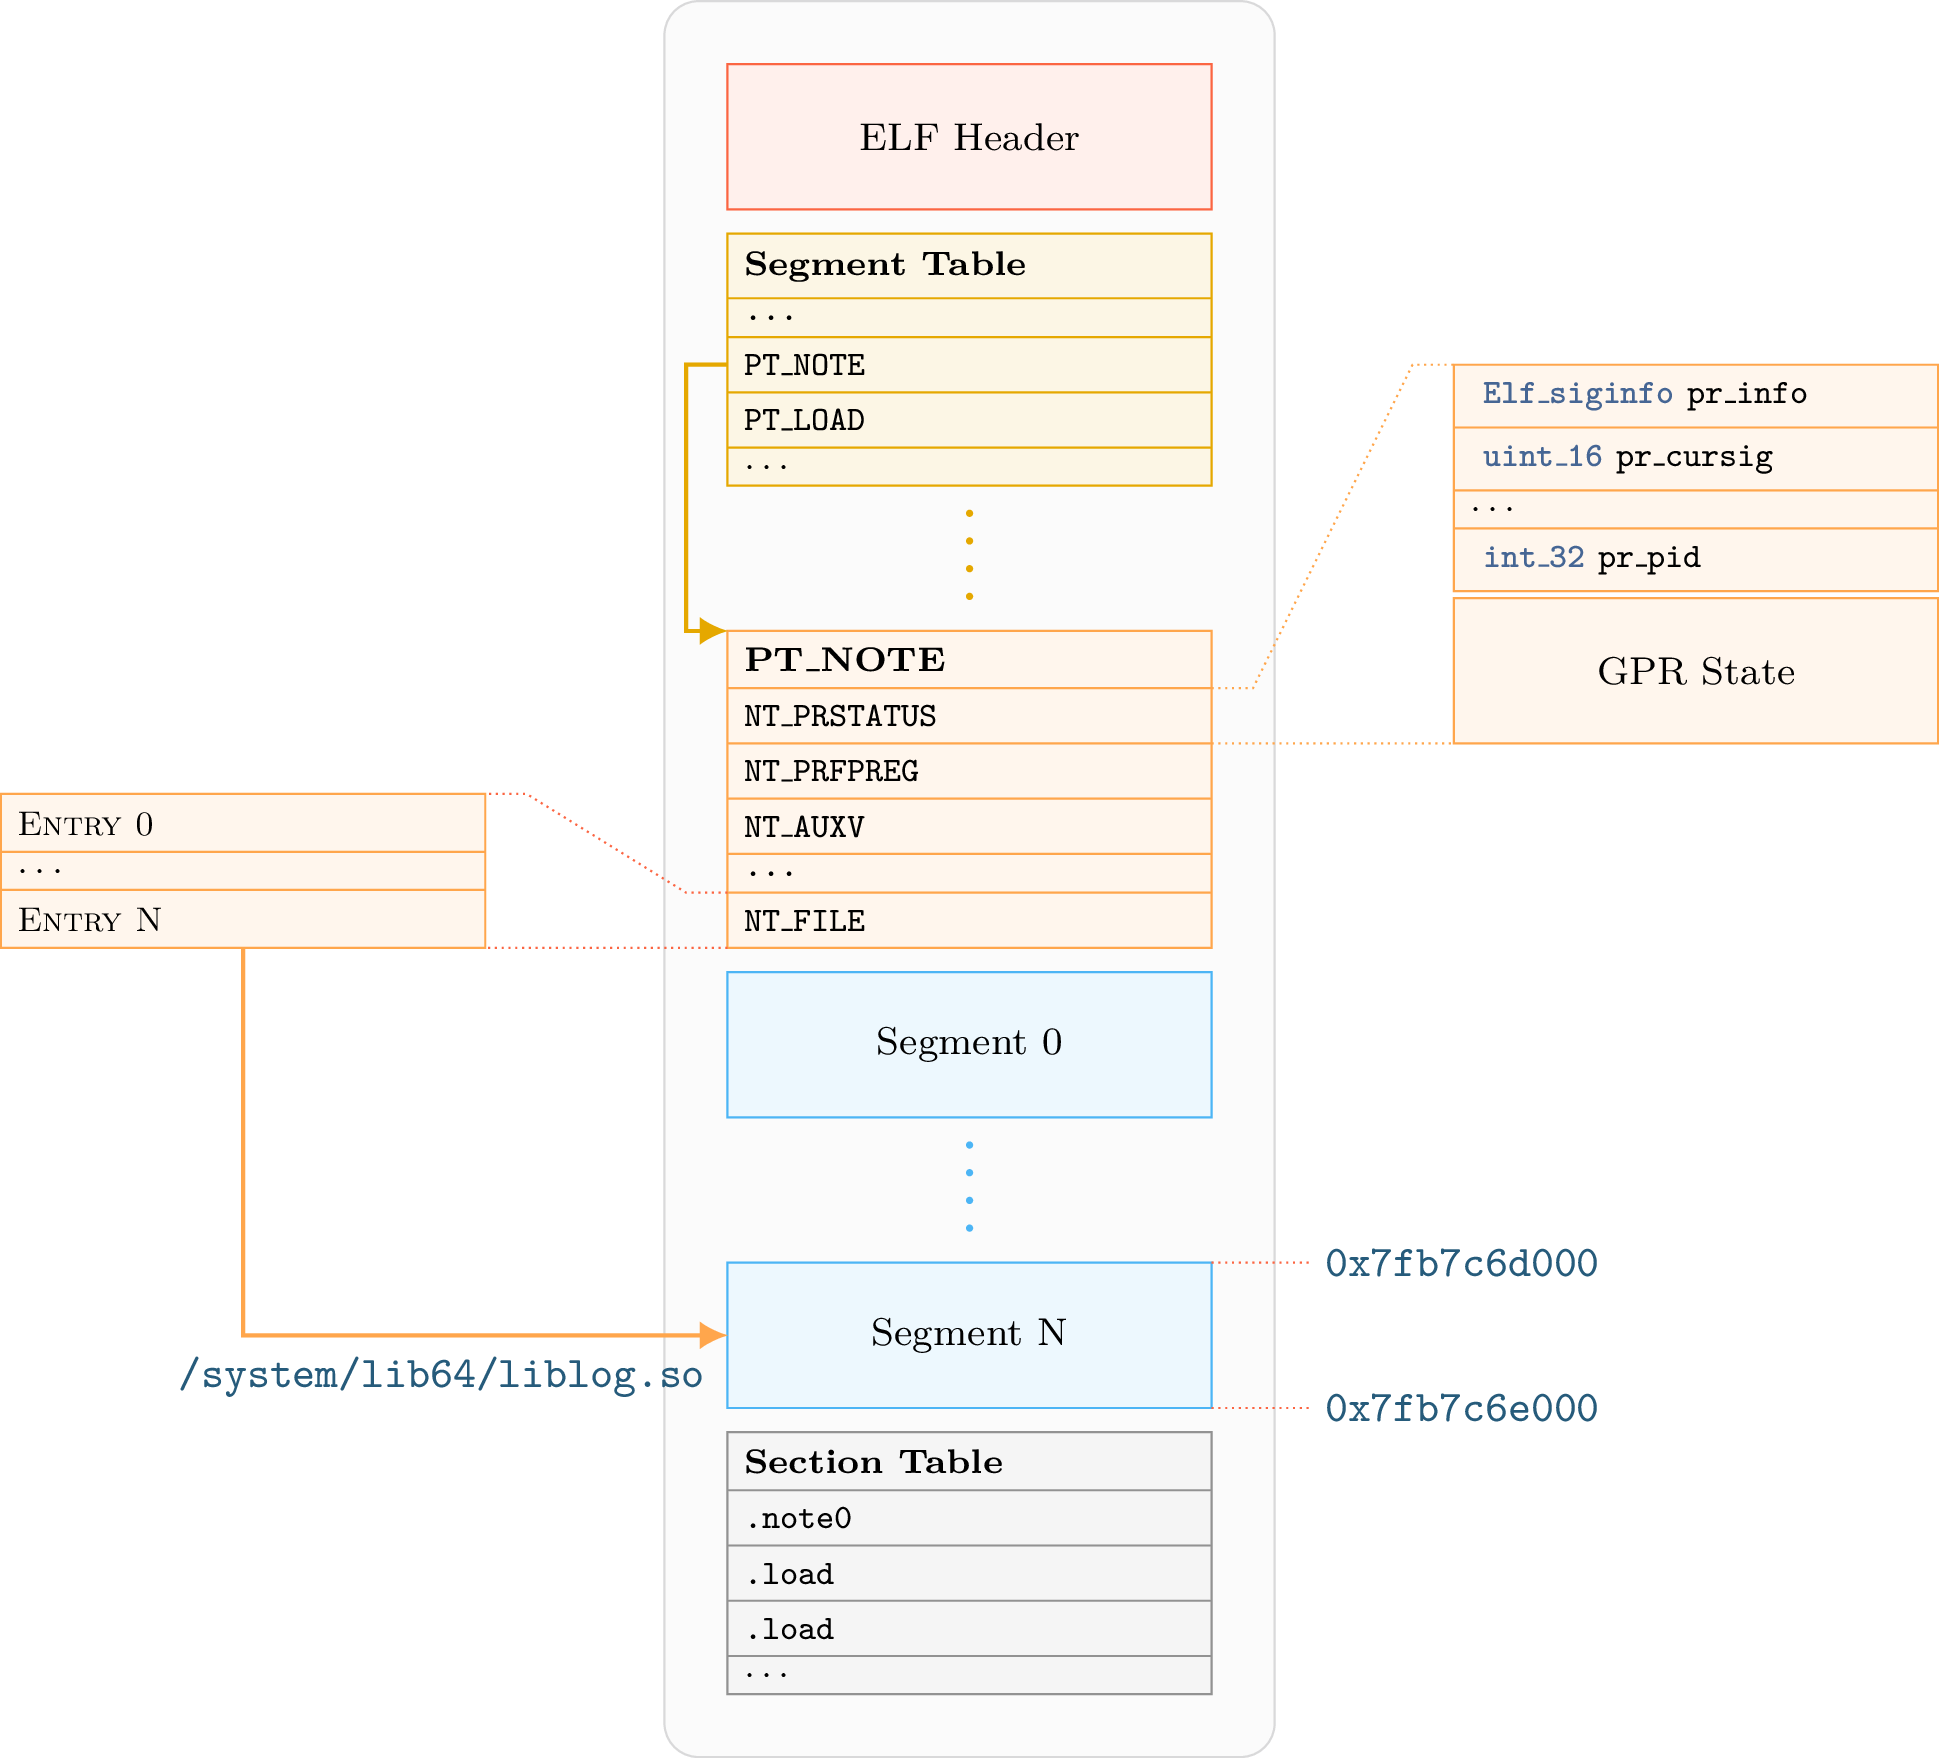
For more details about coredump internal structure, one can look at the following blog post: Anatomy of an ELF core file
Coredump Analysis
As core files are effectively ELF, we can open these files using the lief.parse() function:
import lief

core = lief.parse("ELF64_AArch64_core_hello.core")
We can iterate over the Segment objects to inspect the memory state of the program:
segments = core.segments
print("Number of segments {}".format(len(segments)))

for segment in segments:
   print(hex(segment.virtual_address))
To resolve the relationship between libraries and segments, we can look at the special note lief.ELF.CoreFile:
nt_core_file = core.get(lief.ELF.Note.TYPE.CORE.FILE)
ELF notes are represented through the main lief.ELF.Note interface. Some notes like (lief.ELF.CoreFile) can expose additional API by extending the original lief.ELF.Note.

Note
All note details inherit from the base class lief.ELF.Note (or LIEF::ELF::Note)
Especially, in C++ we must downcast according to the classof function:
for (const Note& note : binary->notes()) {
if (CoreFile::classof(¬e)) {
const auto& nt_core_file = static_cast<const CoreFile&(note);
}
}
Which is roughly equivalent in Python to:
for note in binary.notes:
    if isinstance(note, lief.ELF.CoreFile):
        print("This is a CoreFile note")
We can eventually use the attribute lief.ELF.CoreFile.files or directly iterate on the lief.ELF.CoreFile object. Both give access to the lief.ELF.CoreFileEntry: objects
for file_entry in note_file:
   print(file_entry)
/data/local/tmp/hello-exe: [0x5580b86000, 0x5580b88000]@0
/data/local/tmp/hello-exe: [0x5580b97000, 0x5580b98000]@0x1000
/data/local/tmp/hello-exe: [0x5580b98000, 0x5580b99000]@0x2000
/system/lib64/libcutils.so: [0x7fb7593000, 0x7fb7595000]@0xf000
/system/lib64/libcutils.so: [0x7fb7595000, 0x7fb7596000]@0x11000
/system/lib64/libnetd_client.so: [0x7fb75fb000, 0x7fb75fc000]@0x2000
/system/lib64/libnetd_client.so: [0x7fb75fc000, 0x7fb75fd000]@0x3000
/system/lib64/libdl.so: [0x7fb7a2e000, 0x7fb7a2f000]@0x1000
/system/lib64/libdl.so: [0x7fb7a2f000, 0x7fb7a30000]@0x2000
/data/local/tmp/liblibhello.so: [0x7fb7b22000, 0x7fb7b2a000]@0xcb000
/data/local/tmp/liblibhello.so: [0x7fb7b2a000, 0x7fb7b2b000]@0xd3000
/system/lib64/libc.so: [0x7fb7c0e000, 0x7fb7c14000]@0xc5000
/system/lib64/libc.so: [0x7fb7c14000, 0x7fb7c16000]@0xcb000
/system/lib64/liblog.so: [0x7fb7c6c000, 0x7fb7c6d000]@0x16000
/system/lib64/liblog.so: [0x7fb7c6d000, 0x7fb7c6e000]@0x17000
/system/lib64/libc++.so: [0x7fb7d6f000, 0x7fb7d77000]@0xe2000
/system/lib64/libc++.so: [0x7fb7d77000, 0x7fb7d78000]@0xea000
/system/lib64/libm.so: [0x7fb7db8000, 0x7fb7db9000]@0x36000
/system/lib64/libm.so: [0x7fb7db9000, 0x7fb7dba000]@0x37000
/system/bin/linker64: [0x7fb7e93000, 0x7fb7f87000]@0
/system/bin/linker64: [0x7fb7f88000, 0x7fb7f8c000]@0xf4000
/system/bin/linker64: [0x7fb7f8c000, 0x7fb7f8d000]@0xf8000
From this output, we can see that the Segment of the main executable (/data/local/tmp/hello-exe), are mapped from address 0x5580b86000 to address 0x5580b99000.
One can also access to the registers state by looking for the note: lief.ELF.CorePrStatus.
for note in core.notes:
   if not isinstance(note, lief.ELF.CorePrStatus):
       continue

   # Both are equivalent
   print(note.pc)
   reg_values = note.register_values
   print(reg_values[lief.ELF.CorePrStatus.Registers.AARCH64.PC.value])
0x5580b86f50
0x5580b86f50
Coredump manipulation
LIEF enables, to a certain extent, to modify coredump. For instance, we can update the register values as follows:
prstatus = elf_core.get(lief.ELF.Note.TYPE.CORE_PRSTATUS)
prstatus.set(lief.ELF.CorePrStatus.Registers.AARCH64.PC, 0xDEADC0DE)

core.write("/tmp/new.core")
When opening /tmp/new.core in GDB, we can observe the modification: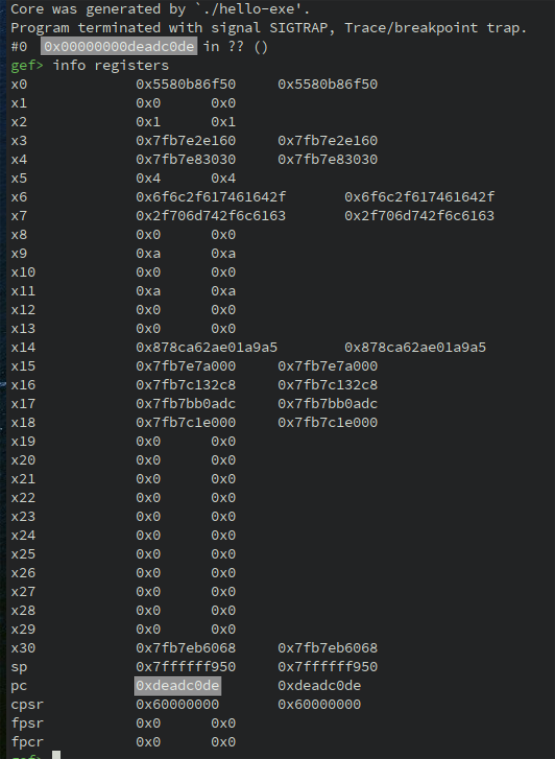
Final word
One advantage of the coredump over the raw binary is that relocations and dependencies are resolved inside the coredump.
This API could be used in association with other tools. For instance, we could use Triton API:
to map the coredump in Triton and then use its engines: Taint analysis, symbolic execution.
References
API